Fulfillment
Safety Stock Formula: Calculating Buffer Inventory for Canadian Cross-Border Fulfillment

For ecommerce brands expanding into Canada, calculating the right amount of buffer inventory is not a guessing game—it is a mathematical discipline that directly impacts both customer satisfaction and capital efficiency. The safety stock formula provides the analytical foundation for determining how much inventory to hold above your expected demand, ensuring you can fulfill orders even when supplier delays, customs holds, or unexpected demand spikes occur. While understanding what safety stock is provides conceptual grounding, this article focuses on the practical calculations that operations managers and inventory planners need to implement when positioning inventory for Canadian fulfillment. We will walk through the core formula, explain each component in detail, and critically address how cross-border replenishment into Canada requires specific adjustments that domestic fulfillment scenarios simply do not demand.

Who This Article Is For
This guide is designed for operations managers, supply chain analysts, and inventory planners at established D2C ecommerce brands processing 500 or more orders monthly. If you are evaluating Canadian market entry, managing cross-border supply chains, or planning Q4 inventory positioning for a Canadian fulfillment center, this content will provide immediately applicable calculations.
This article is not intended for brands just learning basic inventory concepts, startups with minimal sales history, or operations teams looking for general warehouse management advice. We assume you already understand why buffer inventory matters—what you need now is the specific formula and the adjustments required for cross-border complexity.
The Standard Safety Stock Formula Explained
At its core, the safety stock formula quantifies uncertainty. The standard calculation is:
Safety Stock = Z-score × Standard Deviation of Lead Time Demand
Each component serves a distinct purpose:
- Z-score: A statistical factor that corresponds to your desired service level (the probability of not experiencing a stockout during a replenishment cycle)
- Standard Deviation of Lead Time Demand: A measure of how much your demand varies during the time it takes to receive new inventory
This formula assumes that demand during lead time follows a roughly normal distribution—a reasonable assumption for most ecommerce products with consistent sales velocity. The calculation produces a buffer quantity that, when maintained, provides your chosen probability of having sufficient stock to meet demand while awaiting replenishment.
For operations teams, the data inputs come from your order management system (historical demand data) and your supply chain records (lead time history from purchase orders). The more historical data you have, the more accurate your standard deviation calculations become.
Understanding Service Levels and Z-Score Selection
Your service level target represents a strategic decision about how much inventory risk you are willing to accept. Higher service levels require more safety stock investment; lower service levels accept more stockout risk in exchange for reduced carrying costs.
The following table maps common service level targets to their corresponding z-scores:
- 90% service level: Z-score of 1.28
- 95% service level: Z-score of 1.65
- 97% service level: Z-score of 1.88
- 98% service level: Z-score of 2.05
- 99% service level: Z-score of 2.33
For most ecommerce operations, a 95% service level provides a reasonable balance between inventory investment and customer satisfaction. However, certain situations warrant higher targets:
- Flagship SKUs: Products central to your brand promise may justify 97-99% service levels
- Regulated products: For brands in regulated product fulfillment categories like natural health products, food, or cosmetics, stockouts may trigger compliance complications beyond lost sales
- High-margin items: When the cost of a stockout exceeds the cost of holding additional inventory, higher service levels make economic sense
Conversely, slow-moving SKUs or low-margin products may warrant lower service levels to avoid tying up excessive capital in buffer inventory.
Calculating Average Daily Usage and Demand Variability
The demand component of your safety stock calculation requires two figures: average daily sales and the standard deviation of daily sales.
Determining Average Daily Usage
Pull historical sales data for each SKU over a representative period—typically 60 to 90 days of daily unit sales. Calculate the arithmetic mean to establish your average daily demand. If your business experiences significant seasonality, you may need to segment this calculation by season or adjust based on your planning horizon.
Calculating Standard Deviation of Demand
Using the same historical data, calculate the standard deviation of daily demand using spreadsheet functions (STDEV in Excel or Google Sheets). This figure quantifies how much your actual daily sales deviate from the average.
A product with stable, predictable demand will have a low standard deviation relative to its average. A product with erratic sales patterns—perhaps driven by promotional activity or external factors—will show higher variability and consequently require more safety stock to achieve the same service level.
Daily Versus Weekly Periods
For high-volume products, daily demand calculations typically provide sufficient data points for reliable statistics. For slower-moving items, weekly aggregation may produce more stable figures. The key is consistency: if you calculate demand in weekly units, your lead time must also be expressed in weeks.
Lead Time Components for Canadian Cross-Border Fulfillment
Here is where safety stock calculations for Canadian fulfillment diverge significantly from domestic scenarios. When replenishing inventory for a Canadian fulfillment center from international suppliers or from a US-based distribution hub, your total lead time encompasses multiple segments:
- Supplier production or order processing time: The time from placing a purchase order until goods are ready to ship
- Domestic transportation to port or border: Ground freight to the departure point
- Export customs clearance: Documentation processing for outbound shipments
- Cross-border transportation: International transit via ocean, air, or ground freight
- Import customs clearance: Processing through Canadian customs clearance processes
- Final delivery to Canadian fulfillment center: Last-mile freight to your 3PL warehouse
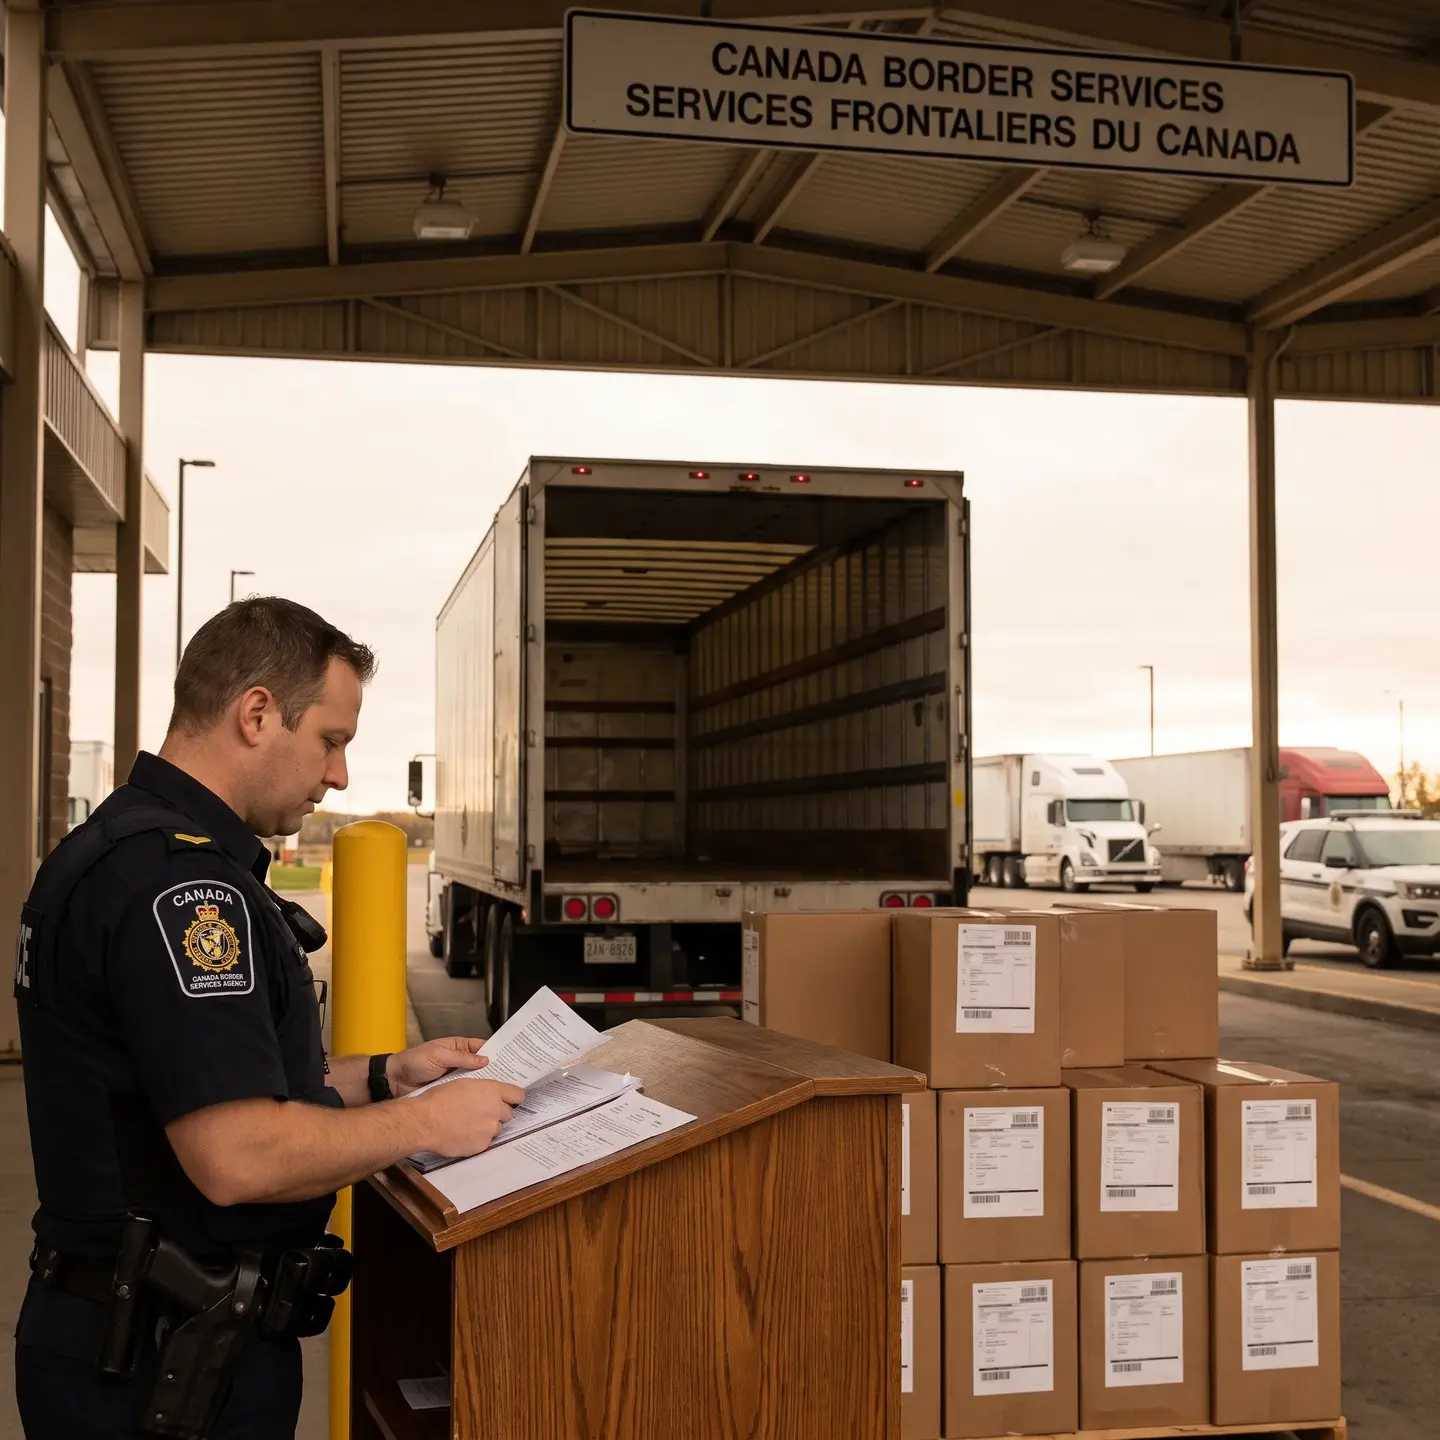
Each segment contributes to both your average lead time and—critically—your lead time variability. Customs clearance is particularly unpredictable: clean, complete shipments may clear in under 24 hours, while shipments requiring clarification can take several business days, and those with documentation issues may be held for a week or longer.
For brands using cross-border fulfillment into Canada, this variability is not an edge case—it is a structural feature of the supply chain that must be reflected in safety stock calculations.
Adjusting for Lead Time Variability in Import Scenarios
Lead time variability dramatically affects safety stock requirements. When your replenishment cycle is domestic—say, a five-day lead time with one-day variability—the uncertainty is modest. When your replenishment cycle crosses an international border with customs processing, regulatory checks, and multi-modal transportation, variability expands significantly.
Freight Mode Impact
Your choice of freight mode affects both average lead time and variability:
- Air freight: Faster average lead time but premium costs; customs processing still introduces variability
- Ocean freight: Lower per-unit costs but significantly longer lead times and greater variability due to port congestion, vessel schedules, and terminal processing
- Ground freight (for US-Canada): Moderate lead times with variability driven primarily by border processing
Regulated Product Considerations
For brands fulfilling natural health products, food, or cosmetics in Canada, additional lead time variability arises from regulatory compliance processes. Products subject to Health Canada natural health product regulations may require documentation verification, product registration confirmation, or facility licensing checks that add time to the customs clearance process.
When calculating lead time standard deviation for regulated products, include this regulatory processing time in your historical data. Products that have experienced delays due to compliance queries will show higher lead time variability and require correspondingly higher safety stock to maintain target service levels.
The Combined Formula: Demand and Lead Time Variability
When both demand and lead time exhibit meaningful variability—the typical scenario for cross-border ecommerce fulfillment—the more sophisticated combined formula provides greater accuracy:
Safety Stock = Z × √[(Average Lead Time × Demand Variance) + (Average Demand² × Lead Time Variance)]
Where:
- Z = Z-score for your target service level
- Average Lead Time = Mean replenishment lead time in days
- Demand Variance = Standard deviation of daily demand, squared
- Average Demand = Mean daily sales in units
- Lead Time Variance = Standard deviation of lead time, squared
This formula accounts for the interaction between both sources of uncertainty. A product with stable demand but highly variable lead time will show a different safety stock requirement than one with volatile demand but predictable lead time—even if the total “uncertainty” feels similar intuitively.
For cross-border fulfillment into Canada, lead time variance often dominates the calculation because customs processing and international transportation introduce substantially more variability than most domestic demand patterns.
Practical Example: Calculating Safety Stock for Canadian Fulfillment
Let us work through a complete calculation for a D2C brand importing products into a Canadian fulfillment center.
Scenario
A natural health products brand imports vitamins from a US supplier into their Canadian 3PL. They want to calculate safety stock for a core SKU.
Input Data
- Average daily demand (d): 100 units
- Standard deviation of daily demand (σd): 20 units
- Average cross-border lead time (L): 45 days
- Standard deviation of lead time (σL): 10 days
- Target service level: 95% (Z-score = 1.65)
Calculation Using Combined Formula
Safety Stock = Z × √[(L × σd²) + (d² × σL²)]
Step 1: Calculate L × σd²
45 × (20)² = 45 × 400 = 18,000
Step 2: Calculate d² × σL²
(100)² × (10)² = 10,000 × 100 = 1,000,000
Step 3: Sum the variance components
18,000 + 1,000,000 = 1,018,000
Step 4: Take the square root
√1,018,000 ≈ 1,009
Step 5: Multiply by Z-score
1.65 × 1,009 ≈ 1,665 units
Comparison: Domestic Scenario
Now consider the same product with domestic replenishment:
- Average lead time: 5 days
- Standard deviation of lead time: 1 day
- Same demand parameters
Safety Stock = 1.65 × √[(5 × 400) + (10,000 × 1)]
= 1.65 × √[2,000 + 10,000]
= 1.65 × √12,000
= 1.65 × 109.5
≈ 181 units
The Inventory Investment Difference
The cross-border scenario requires approximately 1,665 units of safety stock compared to 181 units for domestic replenishment—a difference of nearly 1,500 units. At a product cost of $10 per unit, this represents an additional $14,840 tied up in buffer inventory for the cross-border supply chain.
This quantifies precisely why brands entering the Canadian market need to understand safety stock mathematics before committing to a fulfillment strategy. The inventory investment implications are substantial.
Balancing Safety Stock Costs with Service Level Goals
Safety stock represents capital tied up in inventory. Every unit held as buffer carries a cost: the purchase price of the goods, storage fees, insurance, and the opportunity cost of capital deployed elsewhere.
Annual holding costs typically range from 20-30% of inventory value, depending on product characteristics, storage requirements, and capital costs. For temperature-sensitive regulated products requiring specialized handling, holding costs may be higher.
Evaluating Service Level Investment
Consider the marginal cost of higher service levels. Moving from 95% to 99% service level increases your Z-score from 1.65 to 2.33—a 41% increase in safety stock. This additional inventory investment must be weighed against:
- The revenue protected by avoiding stockouts
- The margin profile of the product
- The competitive importance of availability
- Customer lifetime value implications of fulfillment failures
For high-margin products where stockouts trigger customer defection, the additional safety stock investment often pays for itself. For low-margin commodities, accepting occasional stockouts may be economically rational. Understanding service level agreements with your fulfillment partner helps align these decisions with operational capabilities.
Safety Stock Considerations for Multi-Location Fulfillment
Brands adding Canadian fulfillment to existing US operations face allocation decisions. Should safety stock be concentrated in one location or distributed across both?
The Risk Pooling Effect
Statistical theory suggests that consolidated inventory requires less total safety stock than distributed inventory serving the same demand, because variability partially cancels when aggregated. However, this assumes demand can be served from either location—which is not the case when Canadian customers require Canadian-origin shipments for speed, cost, or regulatory reasons.
Practical Allocation Approach
For most brands, we recommend calculating safety stock independently for each fulfillment node based on the demand and lead time characteristics specific to that location:
- Canadian node: Calculate based on Canadian market demand and cross-border replenishment lead time
- US node: Calculate based on US market demand and domestic replenishment lead time
Attempting to share safety stock across borders introduces complexity that rarely produces meaningful savings, particularly when cross-border emergency shipments are expensive and slow.
Adjusting Safety Stock Levels Over Time
Safety stock is not a set-it-and-forget-it calculation. Regular review ensures your buffer inventory remains aligned with actual performance.
When to Recalculate
- Quarterly planning cycles: Recalculate before major inventory positioning decisions, especially Q4 peak season planning
- After supply chain changes: New suppliers, freight modes, or fulfillment partners change lead time characteristics
- When actual stockout rates deviate from targets: If you are stocking out more frequently than your target service level predicts, your variability inputs may be understated
- After accumulating more historical data: As you gather lead time data from actual cross-border shipments, your standard deviation calculations become more accurate
Monitoring Actual Performance
Track your actual fill rate against your target service level. If you target 95% and consistently achieve 98%, you may be carrying excess safety stock. If you target 95% and experience stockouts on 10% of replenishment cycles, your variability calculations need revision.

Common Calculation Mistakes to Avoid
In our experience working with brands entering the Canadian market, several calculation errors recur:
- Using supplier-quoted lead times instead of actual performance: Quoted lead times are best-case scenarios; actual lead times—including customs delays—are what matter for safety stock
- Ignoring lead time variability: Using only average lead time dramatically understates safety stock needs for cross-border lanes
- Applying domestic assumptions to cross-border scenarios: Lead time variability is structurally higher when customs processing is involved
- Failing to account for regulatory delays: Natural health products, food, and cosmetics may encounter compliance-related holds that must be reflected in lead time data
- Mixing time units: Daily demand must be paired with lead time in days; weekly demand with lead time in weeks
Implementing These Calculations
The safety stock formula provides the mathematical foundation, but implementation requires operational discipline. Begin by establishing data collection processes that capture actual lead times—not just supplier promises—for every replenishment shipment. Build historical datasets that include customs clearance duration, not just transportation time.
When evaluating Canadian fulfillment partners, discuss how they can support your inventory planning with lead time data, stockout alerts, and service level reporting. A 3PL that processes over 40,000 orders weekly with same-day fulfillment for orders received by 1:30 PM EST, as we do across our Ottawa, Toronto, and Vancouver facilities, provides the operational reliability that makes your safety stock calculations meaningful.
For brands fulfilling regulated products, ensure your fulfillment partner maintains compliance infrastructure—like our Intertek SAI Global certification with 100% Superior rating—that minimizes the regulatory delays which otherwise inflate lead time variability and safety stock requirements.
The mathematics of safety stock are straightforward. The challenge lies in gathering accurate data, making principled service level decisions, and partnering with fulfillment operations that deliver the consistency your calculations assume.
Frequently Asked Questions
Use 1.65 for a 95% service level, 1.88 for 97%, 2.05 for 98%, or 2.33 for 99%. Higher targets reduce stockout risk but require more inventory.
Cross-border replenishment includes transportation, export and import customs, and potential regulatory delays. These steps increase lead time variability compared with domestic replenishment.
Review them at least quarterly and whenever suppliers, freight modes, fulfillment partners, demand patterns, or stockout rates change. Recalculate before major seasonal or Q4 inventory decisions.
Safety stock equals the Z-score multiplied by the standard deviation of demand during lead time. For cross-border fulfillment, use the combined formula that accounts for both demand and lead time variability.
Collect average daily demand, demand standard deviation, average replenishment lead time, and lead time standard deviation. Use actual shipment performance, including customs delays, rather than supplier-quoted timelines.

Scale Your Canada Fulfillment with Confidence.
Partner with Canada's premier 3PL to unlock faster shipping, lower costs, and seamless scalability for your ecommerce brand.
Talk to an Expert